
Introduction: The Significance of Visualizing Data Distributions
Visualizing data distributions plays a crucial role in understanding and deriving insights from data. By representing data visually, complex patterns and relationships can be easily identified, leading to a better understanding of the underlying data. In this section, we will explore the significance of visualizing data distributions and the benefits it offers.
The Role of Data Visualization in Understanding Data
Data visualization is the process of representing data in graphical or visual formats such as charts, graphs, and maps. It allows us to analyze large datasets and extract meaningful insights by presenting data in a more intuitive and interactive manner. When it comes to understanding data distributions, visualization provides a powerful tool to analyze the shape, spread, and central tendencies of the data.
Visualizations help us identify patterns, trends, outliers, and potential relationships within the data. By visualizing data distributions, we can identify the underlying distribution type (e.g., normal, skewed, bimodal), grasp the range and variability of the data, and observe any significant deviations or anomalies. This visual representation enables us to perceive the data more holistically and make more informed decisions.
Benefits of Visualizing Data Distributions
Visualizing data distributions offers several benefits that enhance data understanding and analysis:
- Clarity and Simplification: Visual representations of data distributions simplify complex datasets and make them easier to interpret. By transforming numbers and statistics into visual elements, the patterns and structure of the data become more apparent.
- Quick Identification of Patterns: Visualizations enable quick identification of patterns and trends within the data. By observing the shape, skewness, and central tendencies, we can recognize clusters, outliers, or any other interesting features that may require further investigation.
- Effective Communication: Visualizations serve as powerful tools for communicating data insights to a variety of audiences. Visual representations are often more engaging, memorable, and understandable than raw data, allowing stakeholders to grasp the message being conveyed more effectively.
- Data-Driven Decision Making: Visualizing data distributions helps in making data-driven decisions. By visually comparing different distributions, we can analyze the impact of various factors and variables on the data, leading to more informed and accurate decision making.
- Identification of Data Quality Issues: Visualizations can help identify data quality issues such as missing values, data gaps, or errors. By visualizing the distribution of data points, we can easily spot irregularities and take necessary steps to clean and preprocess the data.
In conclusion, visualizing data distributions is essential for understanding data, extracting insights, and making informed decisions. It simplifies the complexity of data, reveals hidden patterns, and aids effective communication of data insights. By utilizing various visualization techniques, data analysts and researchers can unlock the full potential of data and derive meaningful conclusions.
Understanding the Basics: Histograms and Box Plots
In statistics and data analysis, histograms and box plots are two commonly used graphical tools to visualize and analyze data. These tools provide valuable insights into the frequency, distribution, central tendency, and variability of a dataset.
1. Histograms
Histograms allow us to examine the frequency and distribution of data by dividing it into intervals, or bins, and representing the number of data points falling within each bin. The x-axis represents the range of values, while the y-axis represents the frequency or count.
Histograms provide a visual representation of the data’s shape, central tendency, and variability. They are particularly useful for identifying patterns, outliers, and the overall distribution of a dataset. By analyzing the shape of a histogram, we can gain insights into whether the data is symmetric, skewed (positively or negatively), or multimodal.import matplotlib.pyplot as plt
import numpy as np
# Generating random data
data = np.random.normal(loc=0, scale=1, size=1000)
# Creating a histogram
plt.hist(data, bins=30, alpha=0.7, color=’blue’)
plt.title(‘Histogram of Normally Distributed Data’)
plt.xlabel(‘Value’)
plt.ylabel(‘Frequency’)
plt.grid(True)
plt.show()
2. Box Plots
Box plots, also known as box-and-whisker plots, provide a concise summary of the distribution of a dataset. They display the minimum, first quartile (Q1), median (Q2), third quartile (Q3), and maximum values.
The box represents the interquartile range (IQR), which is the range between the first and third quartiles. The height of the box indicates the spread of the middle 50% of the data.
A line across the box represents the median, dividing the data into two equal halves. The whiskers extend from the box and encompass the minimum and maximum values within a certain range.
Box plots help analyze the central tendency and variability of a dataset, including the presence of outliers. They are particularly useful for comparing multiple datasets simultaneously or identifying differences between groups.import seaborn as sns
import numpy as np
# Generating random data
data = np.random.normal(loc=0, scale=1, size=(100, 3))
# Creating a box plot
sns.boxplot(data=data, orient=’h’, palette=”Set2″)
plt.title(‘Box Plot of Randomly Generated Data’)
plt.show()
In summary, histograms and box plots are powerful visualization tools for understanding the frequency, distribution, central tendency, and variability of data. By utilizing these tools, analysts and researchers can gain valuable insights and make informed decisions based on the patterns and characteristics observed in the data.
Exploring Advanced Techniques for Visualizing Data Distributions
Visualizing data distributions is a crucial step in understanding the underlying patterns and characteristics of a dataset. While basic techniques like histograms and box plots provide valuable insights, advanced visualization techniques offer a more comprehensive view of the data. In this section, we will explore seven advanced techniques for visualizing data distributions.
1. Kernel Density Estimation
Kernel Density Estimation (KDE) is a non-parametric technique that estimates the probability density function of a dataset. By providing a smooth curve that approximates the distribution, KDE helps uncover underlying patterns. KDE plots can be used in conjunction with histograms to visualize the distribution with greater clarity.import seaborn as sns
import numpy as np
# Generating random data
data = np.random.normal(loc=0, scale=1, size=1000)
# Creating a KDE plot
sns.kdeplot(data, shade=True, color=’green’)
plt.title(‘Kernel Density Estimation of Data’)
plt.xlabel(‘Value’)
plt.ylabel(‘Density’)
plt.show()

2. Violin Plots
Violin plots combine the benefits of box plots and kernel density plots. They display a compact representation of the distribution by presenting a mirrored density plot on both sides of a central box plot. Violin plots offer a concise view of the distribution’s shape, concentration, and any potential outliers.import seaborn as sns
import numpy as np
# Generating random data
data = np.random.normal(loc=0, scale=1, size=(100, 2))
# Creating a violin plot
sns.violinplot(data=data, inner=”quartile”, palette=”Set3″)
plt.title(‘Violin Plot of Randomly Generated Data’)
plt.show()

3. Empirical Cumulative Distribution Function (ECDF)
The Empirical Cumulative Distribution Function (ECDF) provides a visual representation of the cumulative probability distribution of a dataset. It shows the proportion of values in the dataset that are less than or equal to a given value. ECDF plots are valuable for examining the spread and shape of the distribution, as well as comparing multiple datasets.import numpy as np
import matplotlib.pyplot as plt
# Generating random data
data = np.random.randn(100)
# Calculating ECDF
x = np.sort(data)
y = np.arange(1, len(x)+1) / len(x)
# Creating ECDF plot
plt.plot(x, y, marker=’.’, linestyle=’none’)
plt.xlabel(‘Data points’)
plt.ylabel(‘ECDF’)
plt.title(‘Empirical Cumulative Distribution Function’)
plt.grid(True)
plt.show()

4. Swarm Plots
Swarm plots are effective for visualizing the distribution of categorical data along with individual data points. It presents each data point horizontally, jittering the points in case of overlap, making it easier to see the distribution within each category. Swarm plots are particularly useful when the number of categories is small and there are numerous data points within each category.import seaborn as sns
import matplotlib.pyplot as plt
# Generating random categorical data
categories = [‘A’, ‘B’, ‘C’]
data = sns.load_dataset(“iris”)
# Creating a swarm plot
sns.swarmplot(x=’species’, y=’petal_length’, data=data)
plt.title(‘Swarm Plot of Iris Petal Length’)
plt.show()

5. Ridge Plots
Ridge plots, also known as joy plots, are useful for comparing multiple distributions. They overlay the probability density functions of different distributions, making it easier to discern differences in shape, concentration, and spread. Ridge plots help identify similarities and differences between datasets, aiding in comparative data analysis.import seaborn as sns
import pandas as pd
import numpy as np
import matplotlib.pyplot as plt
from scipy import stats
# Generating random data
data = pd.DataFrame(data = np.random.normal(size=(100, 6)), columns=[‘A’, ‘B’, ‘C’, ‘D’, ‘E’, ‘F’])
# Creating ridge plots
g = sns.FacetGrid(data.melt(var_name=’Column’, value_name=’Value’), hue=’Column’, aspect=4, height=2, palette=”tab10″)
# Mapping the KDE plots for each category
g.map(sns.kdeplot, ‘Value’, clip_on=False, shade=True, alpha=0.7, lw=3)
g.map(sns.kdeplot, ‘Value’, clip_on=False, color=”w”, lw=2)
# Adding a title
g.fig.suptitle(‘Ridge Plot of Randomly Generated Data’)
g.fig.subplots_adjust(top=0.92)
plt.show()

6. QQ Plots
Quantile-Quantile (QQ) plots are used to assess how well a distribution fits a theoretical distribution, such as a normal distribution. QQ plots compare the quantiles of the observed data against the quantiles expected from the theoretical distribution. Deviations from a straight line indicate deviations from the assumed distribution, helping to identify departures from normality or other assumptions.import numpy as np
import scipy.stats as stats
import matplotlib.pyplot as plt
# Generating random data
data = np.random.normal(loc=0, scale=1, size=100)
# Creating QQ plot
stats.probplot(data, dist=”norm”, plot=plt)
plt.title(‘QQ Plot’)
plt.show()

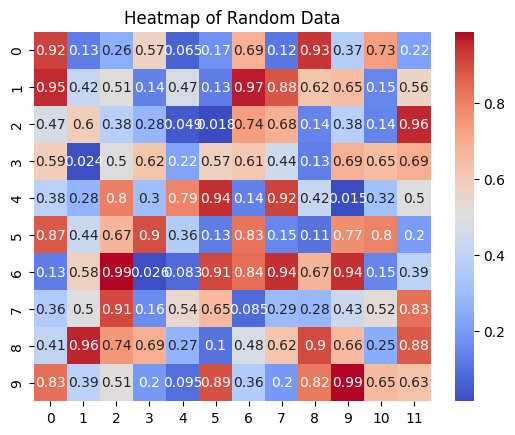
7. Heatmaps
Heatmaps are an effective way to visualize 2D data distributions. By representing data values with colors on a grid or rectangular layout, heatmaps help identify clusters, patterns, and correlations between two variables. Heatmaps are particularly useful when dealing with large datasets or data with multiple dimensions.
By utilizing these advanced data visualization techniques, analysts and researchers can gain a deeper understanding of data distributions, uncover hidden patterns, and make more informed decisions based on comprehensive insights.import seaborn as sns
import matplotlib.pyplot as plt
# Generating a random dataset
data = np.random.rand(10, 12)
# Creating a heatmap
sns.heatmap(data, annot=True, cmap=’coolwarm’)
plt.title(‘Heatmap of Random Data’)
plt.show()

Implementing Data Visualization Techniques in Python
Data visualization is an integral part of data analysis, as it allows us to understand and communicate patterns, trends, and insights effectively. In Python, there are several popular libraries that offer powerful tools for creating visually appealing and informative visualizations. This section will provide an overview of these libraries, a step-by-step guide for creating histograms and box plots, and coding examples for implementing advanced techniques.
Overview of Popular Python Libraries for Data Visualization
Python provides various libraries for data visualization, each with its own strengths and areas of specialization. Some of the most widely used libraries include:
- Matplotlib: A comprehensive library for creating static, animated, and interactive visualizations. It offers a wide range of plot types and customization options.
- Seaborn: Built on top of Matplotlib, Seaborn provides a high-level interface for creating visually appealing statistical graphics. It simplifies the process of creating complex visualizations and offers advanced statistical functionalities.
- Plotly: Plotly is a library that allows you to create interactive and highly customizable visualizations. It offers a wide range of visualizations, including charts, maps, and dashboards.
- Bokeh: Bokeh is a library that specializes in creating interactive visualizations for the web. It allows you to create interactive plots, widgets, and dashboards that can be easily embedded in web applications.
- Pandas: While not a dedicated visualization library, Pandas offers a convenient interface for creating basic visualizations directly from data frames. It integrates well with other libraries like Matplotlib and Seaborn.
Coding Examples for Implementing Advanced Techniques
Once you are comfortable with basic visualizations, you can explore more advanced techniques. Here are a few coding examples to get you started:
- Heatmaps: Heatmaps are useful for visualizing the correlation between variables. You can create a heatmap using Seaborn: “` python import seaborn as sns import numpy as np
import seaborn as sns
import numpy as np# Generating a random correlation matrix
data = np.random.rand(10, 10)
correlation_matrix = np.corrcoef(data)# Creating a heatmap
sns.heatmap(correlation_matrix, annot=True, cmap=’coolwarm’)
plt.title(‘Heatmap of Correlation Matrix’)
plt.show()
These examples only scratch the surface of what you can achieve with Python’s data visualization libraries. Experiment with different plot types, customizations, and datasets to create insightful and visually appealing visualizations.
In summary, Python offers a wide range of libraries for data visualization, including Matplotlib, Seaborn, Plotly, Bokeh, and Pandas. By using these libraries, you can create various types of visualizations to explore and communicate insights from your data. Start with the basics like histograms and box plots, and gradually experiment with more advanced techniques like heatmaps and 3D plots to unlock the full potential of data visualization in Python.
Considerations for Effective Data Visualization
To effectively visualize data and communicate insights, several important considerations should be taken into account.
Choosing the Appropriate Visualization Technique for the Data
The first step in creating effective data visualizations is selecting the right visualization technique. Different types of data can be best represented using specific visualizations. For example:
- Bar charts and pie charts are suitable for comparing and displaying categorical data.
- Line charts are useful for showing trends and changes over time.
- Scatter plots and bubble charts can illustrate relationships and correlations between variables.
- Maps and geospatial visualizations are effective for displaying data with a geographic component.
By carefully choosing the appropriate visualization technique, the data can be presented in a way that helps viewers understand the information more easily.
Best Practices for Labeling, Color Choice, and Clarity
To ensure clarity and understanding, it is important to follow best practices for labeling and color choice in data visualizations:
- Labels should be clear, concise, and informative. They should accurately describe the data being presented and avoid any ambiguity.
- Color choice plays a crucial role in data visualization. Colors should be intuitive and visually appealing. Avoid using excessive or clashing colors that may confuse viewers.
- Use legends and titles to provide additional context and explanation for the visualizations.
- Consider the use of tooltips or interactivity to provide additional information or allow users to explore the data in more detail.
By paying attention to these details, data visualizations can effectively convey the intended message and facilitate interpretation.
Interpreting and Communicating Insights from Visualizations
Simply creating visualizations is not enough; the ability to interpret and communicate insights derived from the data is equally important. Here are some tips for effectively analyzing and conveying insights:
- Clearly define the objective of the visualization and identify the key message you want to convey.
- Annotate the visualization to highlight important trends, patterns, or outliers in the data.
- Use descriptive captions or titles to provide context and guide viewers’ understanding.
- Consider the audience and tailor the communication of insights accordingly. Avoid jargon or technical terms that may be unfamiliar to the intended audience.
- Present the visualizations in a logical order and provide a narrative flow to guide viewers through the insights revealed by the data.
By following these guidelines, data visualizations can effectively communicate insights, aiding decision-making processes and facilitating understanding of complex data sets.
In summary, effective data visualization entails carefully selecting the appropriate visualization technique, adhering to best practices for labeling and color choice, and skillfully interpreting and communicating insights. By considering these factors, data visualizations can become powerful tools for understanding and analyzing data.
Real-World Examples and Applications
To better understand the practical applications and benefits of data visualization, let’s explore some real-world case studies and examples across different domains:
1. Healthcare
Case Study: Medical Data Analysis A hospital used data visualization techniques to analyze patient data and identify patterns and trends in the occurrence of diseases. By visualizing the data, healthcare professionals were able to make informed decisions related to patient care, resource allocation, and preventive measures.
Practical Application: Real-time Monitoring Data visualization plays a crucial role in real-time monitoring of patient vitals in intensive care units. By presenting vital signs graphically, doctors and nurses can quickly identify abnormalities and take timely actions to prevent any complications.
2. Finance
Case Study: Market Trends Analysis A financial institution utilized data visualization to analyze market trends and patterns, enabling traders and investors to make informed decisions. By visualizing historical data and real-time market movements, they were able to identify profitable opportunities and mitigate risks.
Practical Application: Portfolio Management Data visualization tools are widely used in portfolio management to track and analyze investment performance. By visually representing portfolio metrics, asset allocation, and risk exposures, investors can make data-driven decisions and optimize their investment strategies.
3. Marketing
Case Study: Customer Segmentation A retail company leveraged data visualization techniques to segment its customer base and better understand their preferences and behaviors. By visualizing customer data, marketers were able to tailor their marketing strategies, personalize promotions, and improve customer engagement.
Practical Application: Campaign Performance Tracking Data visualization is crucial for tracking the performance of marketing campaigns across various channels. Visualizing metrics such as click-through rates, conversions, and customer engagement helps marketers identify the most effective tactics and optimize future campaigns.
4. Supply Chain Management
Case Study: Logistics Optimization A logistics company used data visualization to optimize its supply chain operations. By visualizing the movement of goods, transportation routes, and inventory levels, they were able to identify bottlenecks, streamline processes, and reduce costs.
Practical Application: Demand Forecasting Data visualization can assist supply chain managers in understanding demand patterns and forecasting future demand. By visualizing historical sales data, market trends, and external factors, companies can optimize their inventory levels, reduce stockouts, and improve customer satisfaction.
These examples demonstrate how data visualization techniques are applied in various domains to gain insights, make informed decisions, and improve overall performance. By effectively visualizing data, businesses can unlock hidden patterns, enhance communication, and drive innovation.
Conclusion: Mastering Data Visualization for Data Distributions
In conclusion, data visualization is an essential tool for effectively understanding and interpreting data distributions. Throughout this article, we explored various techniques for visualizing data distributions, each with its own strengths and use cases.
Recap of Visualization Techniques: We discussed several popular visualization techniques, including histograms, box plots, kernel density plots, and violin plots. Each technique offers a unique perspective on data distributions, allowing analysts to identify patterns, outliers, and underlying trends.
Importance of Data Visualization: Data visualization plays a crucial role in data analysis and decision-making. By visually representing data distributions, analysts can gain valuable insights, extract meaningful patterns, and make informed decisions based on the data at hand. Visualizations also facilitate the communication of complex ideas and findings to stakeholders, making it easier to convey actionable information.
Effective data visualization enables analysts to:
- Identify data outliers and anomalies.
- Understand the central tendencies and dispersion of data.
- Compare and contrast different datasets or groups.
- Discover underlying patterns, trends, or relationships.
- Communicate findings and insights to non-technical audiences.
Overall, mastering data visualization for data distributions is a valuable skill for data analysts, researchers, and decision-makers. By effectively visualizing data, analysts can unlock the full potential of their datasets, uncover hidden patterns, and make data-driven decisions. Moreover, with the increasing availability of powerful visualization tools and libraries, individuals and organizations can take advantage of these techniques to drive innovation and gain a competitive edge.
In conclusion, data visualization empowers analysts to explore, understand, and communicate data distributions effectively. By leveraging a diverse range of visualization techniques, analysts can unlock invaluable insights and drive evidence-based decision-making. Therefore, investing in mastering data visualization is crucial for anyone working with data and seeking to gain a competitive advantage in the data-driven landscape.
Reference: